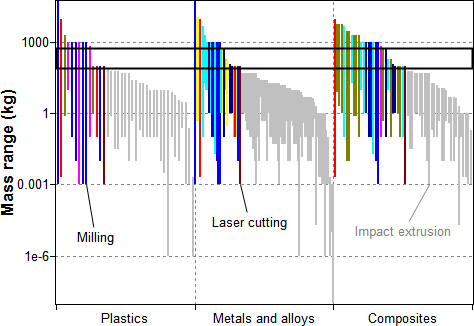
Chart created in MaterialUniverse, with
material records grouped by MaterialUniverse family.

Chart created in ProcessUniverse. The processing
records are grouped by links to material records in MaterialUniverse.
You can create charts with records grouped on the chart axes. Records can be grouped based on links to another data table, or grouped based on the folders in the current browse tree.
To plot grouped records on a chart axis, in the Chart Stage wizard:

Chart created in MaterialUniverse, with
material records grouped by MaterialUniverse family.

Chart created in ProcessUniverse. The processing
records are grouped by links to material records in MaterialUniverse.
Using data from other tables (cross-tabular selection) is only available if there are links from the selected table to other tables.
The folders available on the tree depends on the Subset for the selected table.
In the Set Axis dialog, a folder can also be inserted into the expression by double-clicking the folder name. To remove a folder from the expression, highlight the text to be deleted and press Delete.