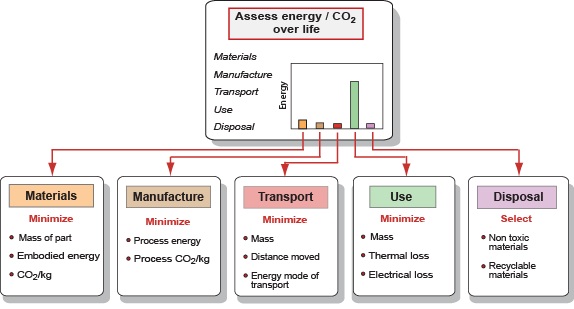
The aim of the eco audit tool is to enable product designers to quickly evaluate the environmental impact of their product, and to provide guidance on how to reduce it. This is achieved by focusing on two well-understood environmental stressors, energy usage and CO2 footprint, and identifying which of the main life phases (material, manufacture, transport, use, and end-of-life) is most demanding of both.
|
|
This is the starting point for eco-aware product design. Identification of the dominant phase enables a designer to establish which aspect of the design to target to minimize its environmental footprint.
In 'material selection' terminology, the result of the eco audit forms the objective for the product design. This objective is dependent on both the dominant phase and the product application. For example, when the use phase is dominant, the objective for a car would be to minimize mass, whereas for a boiler, it would be to minimize thermal loss.
More detailed guidance on how to use the material selection tools to identify materials and processes with lower environmental impact is provided in the Strategies for reducing environmental impact section.
The analysis of the product life cycle is split into three main sections in the eco audit tool:
The first section of the product definition allows entry of the 'bill of materials' for the product, with each line representing an individual component. There is no limit on the number of components that can be added.
Reading across the BoM, the entries are as follows:
The quantity column enables the specification of duplicate components. For example, 40 spokes in a bicycle wheel. The default value is 1.
Text field for entering the name of each individual component.
The material browse dialog displays the full MaterialUniverse tree of the active database. Materials are selected by browsing the tree and clicking on the record for the material of interest. Once selected, the eco audit tool extracts data from the material record to determine what options to display in the 'Primary process' and 'End of life' menus.
The MaterialUniverse tree also includes a limited folder of electrical components, containing records such as batteries, liquid crystal displays, printed circuit board assemblies, cables / power supplies, and materials frequently used in electronic devices (e.g. solder). These records enable the relatively high environmental burden of these sub-assemblies to be accounted for.
For further information on the use, source, and precision of environmental data in the eco audit tool see: data usage, data sources, and data precision.
Certain products include components that do not contribute to all life phases. For example, the water in a drinks bottle contributes to the transportation phase but not the material and manufacturing phases. This contribution is handled by creating a 'dummy' component with no material, or processes, assigned to it.
If you are using a reused part, you need to specify the material it is made from.
If a material contains substances on the EU or US critical lists, or the ChemSec SIN (Substitute It Now) List, it is flagged with a colored symbol to warn you that you need to either select a different material, or consider the implications of using this material in your product. There are three types of warning:
For further information, see Critical materials and restricted substance indicators.
Field for specifying the recycled content of the material. By default, a material is classified as virgin, containing no recycled content. A user-defined value can be specified by typing over the default setting with a value between 0 and 100. You can also choose to reuse a part.
0% represents the use of virgin material, where all the feedstock is produced from raw materials. 100% represents the other extreme, where the material is manufactured entirely from feedstock reclaimed from end of life components.
Typical % lies between the two extremes and accounts for the level of recycled material incorporated back into the supply chain as standard practice. This applies to materials, such as metals and glasses, where end of life recycling has become integrated into the supply chain. This practice leads to standard grades containing significant levels of recycled material. For example, lead alloys generally contain 50–60% recycled material.
Although many materials can be recycled, and have 'recycle fraction in current supply' values quoted in the database, they are not routinely reintroduced into the standard supply. As a result, the 'typical' recycle content option is only displayed for grades of metal and glass that are flagged as recyclable.
Another option available is to reuse a part. This involves taking a previously manufactured component from a product at the end of its lifecycle, and reusing the component in a new product.
The calculations used to determine the environmental burden of grades containing recycled material are as follows:
In cases where 'Typical %' is selected, Rf = [Recycle fraction in current supply]
If the material comes from a reused part, then there is no contribution from the material to the embodied energy and CO2 footprint.
Numeric field for specifying the mass of the final component. This value is multiplied by the quantity (Qty) field value to determine the total mass of these components in the product.
The primary process dropdown menu displays the processes that are applicable to the material selected. This information, and associated data, is extracted from the material's datasheet (see data usage). The table summarizes the list of available primary processes for the Level 1 and 2 databases:
| Material | Process |
| Metals | Casting |
| Extrusion, foil rolling | |
| Roll forming, forging | |
| Wire drawing | |
| Metal powder forming | |
| Vaporization | |
| Polymers & elastomers | Polymer molding |
| Polymer extrusion | |
| Technical ceramics | Incl. in material value |
| Non-technical ceramics | Incl. in material value |
| Glasses | Glass molding |
| Composites | Compression molding |
| Advanced composite molding | |
| Natural materials | Incl. in material value |
| Electrical components | Incl. in material value |
Note: For several material classes (ceramics, natural materials and electrical components), the energy associated with the primary shaping process is included in the value for producing the raw material (Embodied energy / CO2 footprint, primary production). In these cases, 'Incl. in material value' is displayed in the 'Primary process' column.
Only available in some editions
The secondary process box displays all viable machining processes for the selected material. This information, and associated data, is extracted from the material's datasheet (see data usage).
The one exception is 'Cutting and trimming', which is available for all materials. In this case, where large percentages of material can be removed with simple cutting or stamping processes, nominal values are used for the energy and CO2 footprint (0.3MJ/kg and 0.023kgCO2/kg). This approach is valid, as the environmental footprint of the material removed is generally much larger than that associated with the cutting or trimming process.
Only available in some editions
Numeric field for specifying the percentage of material removed by the specified secondary process. In all cases it is assumed that this manufacturing waste is sorted at source and reclaimed by recycling or downcycling.
Note: The specification of a secondary machining process and the associated production of manufacturing waste impacts both the material and manufacturing phases of the life cycle. In particular, it increases both the amount of material used in making the product and the amount of material processed by the primary process.
For more information and details on the influence of manufacturing waste on the material and manufacture phases, see material and manufacture calculations.
This drop-down menu displays all viable end of life options for the selected material. Of the seven options (see Table 2) the validity of the first four: 'Landfill', 'Combust for energy recovery', 'Recycle' and 'Downcycle' is determined by the associated status flag on the material's datasheet (see data usage). The remaining 'Re-manufacture', 'Reused' and 'None' options, which are not specified on the datasheet, are added as viable options for all materials. 'None' applies to components that have no end of life costs. For example, building foundations that are left in the ground, and 'dummy' components (see material section).
See end of life calculations for further information on the end of life analysis and associated calculations.
| End of life option | Applicable materials |
| Landfill | All non-toxic materials |
| Combust (for energy recovery) | All organic-based materials with a heat of combustion value >5 MJ/kg |
| Downcycle | All |
| Recycle | All unfilled: metals / glasses / thermoplastics /TPEs Particulate filled thermoplastics Particulate & whisker reinforced metals (All ceramics / thermosets / elastomers / natural organic / natural inorganic materials and all fiber reinforced materials are marked as non-recyclable) |
| Re-manufacture | All |
| Reuse | All |
| None | All |
The default option for end of life is generally 'Landfill'. The main exception is for toxic materials, which default to the next viable option (typically 'downcycle').
Only available in some editions
Numeric field for specifying the percentage of material that is expected to be recovered at end of life. Although the default value is 100%, in practice only a certain percentage of components will be recovered by the intended end of life route.
The likelihood that a material/product will be reclaimed at end of life will depend on many factors, including:
As a result, materials such as steels and glasses, which have well-established infrastructure for recovering material at end of life, have high recovery rates. In contrast, materials such as engineering plastics, which can be recycled but are not supported by established reclamation systems, have much lower recovery rates.
Material that is not recovered is assumed to be disposed of in landfill.
Note: In certain versions of tool, there is no option to specify a 'Recovery rate'. In these cases, it is assumed that all material is recovered and processed by the selected end of life route (i.e. r = 100).
Only available in some editions
This second section of the product definition allows the specification of joining and finishing processes. These processes are separated out from the individual components as they are frequently applied to two or more parts. There is no limit on the number of processes that can be added.
Text field for entering the name of each individual joining and coating process.
This dropdown menu lists the joining and finishing processes that can be specified.
| Process | Energy (MJ/unit) | CO2/unit) | Unit | |
| Joining | Adhesives, cold curing | 9.9 | 1.9 | m2 |
| Adhesives, heat curing | 27 | 4.7 | m2 | |
| Fasteners, large | 0.071 | 0.0052 | - | |
| Fasteners, small | 0.028 | 0.0021 | - | |
| Welding, electric | 2.4 | 0.17 | m | |
| Welding, gas | 1.7 | 0.091 | m | |
| Construction | 0.1 | 0.0075 | kg | |
| Finishing | Painting | 12 | 0.98 | m2 |
| Electroplating | 89 | 4.8 | m2 | |
| Baked coating | 21 | 1.1 | m2 | |
| Powder coating | 76 | 4.1 | m2 |
Note: The environmental data associated with these processes is independent of the materials to which they are applied. Although this is not strictly correct (for example, some metals are harder to weld than others) it is a valid approximation, given the general precision of environmental data (see data precision), that allows this type of process to be accounted for.
Numeric field for specifying the amount of joining or finishing process used.
Field that displays the relevant unit for specifying the amount of processing carried out. Updates automatically when a process is selected.
The second part of the product definition is the transportation phase. This relates to the transport of the finished product from the source of manufacture to the customer.
Each line in the table relates to one stage of the journey. There is no limit on the number of stages that can be added. For each stage, three parameters are defined: stage name, transport efficiency, and distance.
The transport efficiency is specified through the 'transport type' menu, which lists the main methods for transporting freight (see Table 4).
| Transport energy (MJ/tonne/km) |
CO2 footprint, source (kg/MJ) |
|
| Ocean freight | 0.18 | 0.072 |
| Coastal freight | 0.27 | 0.072 |
| River / canal freight | 0.40 | 0.072 |
| Rail freight | 0.35 | 0.072 |
| 55 tonne (8 axle) truck | 0.71 | 0.072 |
| 40 tonne (6 axle) truck | 0.82 | 0.072 |
| 32 tonne (4 axle) truck | 0.94 | 0.072 |
| 26 tonne (3 axle) truck | 1.1 | 0.072 |
| 14 tonne (2 axle) truck | 1.5 | 0.072 |
| Light goods vehicle | 2.2 | 0.072 |
| Air freight - long haul | 6.5 | 0.072 |
| Air freight - short haul | 13 | 0.072 |
| Helicopter | 55 | 0.072 |
For further information on the source of this data see the 'transport and use' section of data sources.
These energy usage and CO2 footprint values are combined with the product mass and distance to determine the environmental impact of each stage.
Transport Energy = Transport energy per unit mass & distance • Distance • Product mass
Transport CO2 = Transport energy per unit mass & distance • Distance • Product mass • CO2 footprint (source)
The final stage of the product definition is the use phase.
Numeric field for specifying the product life, in years. The default value is 1 year.
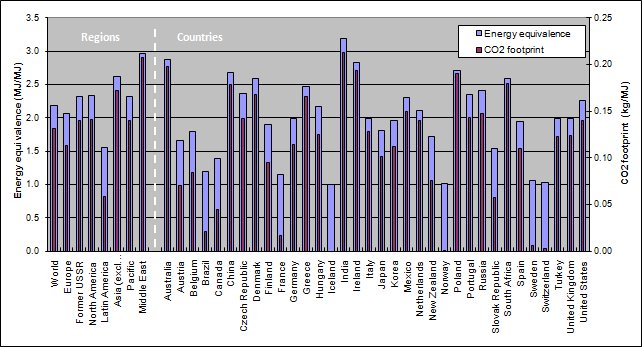
The 'Country electricity mix' drop-down menu enables the particular mix of fossil and non-fossil fuel of the country of use to be specified. This is split into three main groups: global regions, individual countries, and fossil fuel percentage. The default option is 'World'.
This specification of country of use is important, as the environmental burden of electricity generated from fossil fuels is significantly higher than that derived from other sources, such as nuclear, hydroelectric, and wind power. This is due to the relatively low efficiency in converting fossil fuels to electricity (1 MJ of electricity requires about 3 MJ of fossil fuel). The impact of a country's energy mix on the energy equivalence and CO2 footprint of its electricity supply is summarized in the chart below.
The final grouping in the 'country electricity mix' menu specifies the electricity mix based on the proportion derived from fossil fuels (0% to 100% at 5% intervals). The environmental impact of these has been calculated using the following assumptions:
The CO2 footprint of electricity is dominated by the contribution from fossil fuels, with the proportion derived from other sources having no, or negligible, contribution.
The conversion process for generating electricity from fossil fuels is taken to be 33% efficient.
For more information on the country electricity mix data see country electricity mix.
The use phase is divided into two modes of operation, static, and mobile.
Static relates to products that are (normally) stationary but require energy to function. For example: electrically powdered products like electric kettles, refrigerators, and power tools.
Mobile relates to transportation systems, where mass has a large influence on energy consumption.
To define these modes of use, 'check' the 'static mode' and 'mobile mode' boxes. For products that operate in both modes, check both boxes.
Three parameters define the static use mode: Product efficiency, power rating, and the duty cycle.
The product efficiency is specified through the 'Energy input and output' dropdown menu. This specifies the energy conversion efficiency of the product and the environmental burden associated with its energy source (see Table 5). For electric products, the energy equivalence and CO2 footprint values depend on the country of use (see 'country electricity mix').
| Input and output type | Product efficiency | Energy equivalence, source (MJ/MJ) |
CO2 footprint, source (kg/MJ) |
| Electric to thermal | 1 | Country specific | Country specific |
| Electric to mechanical (electric motors) | 0.89 | Country specific | Country specific |
| Electric to chemical (lead acid battery) | 0.83 | Country specific | Country specific |
| Electric to chemical (advanced battery) | 0.89 | Country specific | Country specific |
| Electric to EM radiation (incandescent lamp) | 0.17 | Country specific | Country specific |
| Electric to EM radiation (LED) | 0.86 | Country specific | Country specific |
| Fossil fuel to thermal, enclosed system | 1 | 1 | 0.072 |
| Fossil fuel to thermal, vented system | 0.70 | 1 | 0.072 |
| Fossil fuel to electric | 0.35 | 1 | 0.072 |
| Fossil fuel to mechanical, internal combustion | 0.30 | 1 | 0.072 |
| Fossil fuel to mechanical, steam turbine | 0.40 | 1 | 0.072 |
| Fossil fuel to mechanical, gas turbine | 0.48 | 1 | 0.072 |
| Light to electric (solar cell) | 1* | 1 | 0 |
* Note: Although the efficiency of solar cells is typically about 0.3 (or 30%), a value of 1 has been specified as no environmental burden arises owing to the inefficiency of this energy conversion process.
For further information on the source of this data see the 'transport and use' section of data sources.
The product power rating and duty cycle are specified by the 'Power rating' and 'Usage' inputs. These parameters are combined with the product efficiency values to determine the static mode contribution:


The mobile use mode is defined by three parameters: the transport type, efficiency, and the distance travelled over the product's life.
The transportation type and efficiency is specified through the 'Fuel and mobility type' drop-down menu. This determines the environmental burden associated with the transportation and fuel type (see Table 6). For electric transportation modes, the energy equivalence and CO2 values depend on the country of use (see 'country electricity mix').
| Fuel and vehicle type | Energy (MJ/tonne.km) |
Energy equivalence, source (MJ/MJ) |
CO2 footprint, source (kg/MJ) |
| Diesel - ocean shipping | 0.18 | 1 | 0.072 |
| Diesel - coastal shipping | 0.27 | 1 | 0.072 |
| Diesel - barge | 0.40 | 1 | 0.072 |
| Diesel - rail | 0.35 | 1 | 0.072 |
| Diesel - 55 tonne (8 axle) truck | 0.71 | 1 | 0.072 |
| Diesel - 40 tonne (6 axle) truck | 0.82 | 1 | 0.072 |
| Diesel - 32 tonne (4 axle) truck | 0.84 | 1 | 0.072 |
| Diesel - 26 tonne (3 axle) truck | 1.1 | 1 | 0.072 |
| Diesel - 14 tonne (2 axle) truck | 1.5 | 1 | 0.072 |
| Diesel - light goods vehicle | 2.2 | 1 | 0.072 |
| Diesel - family car | 1.7 | 1 | 0.072 |
| Gasoline - family car | 2.6 | 1 | 0.068 |
| Gasoline - super sports car and SUV | 3.4 | 1 | 0.068 |
| Hybrid gasoline/electric - family car | 1.4 | 1 | 0.053 |
| Electric - rail | 0.11 | Country specific | Country specific |
| Electric - family car | 0.11 | Country specific | Country specific |
| LPG - family car | 2.6 | 1 | 0.064 |
| Kerosene - long haul aircraft | 6.5 | 1 | 0.072 |
| Kerosene - short haul aircraft | 13 | 1 | 0.072 |
| Kerosene - helicopter | 55 | 1 | 0.072 |
For further information on the source of this data see the 'transport and use' section of data sources.
These values are combined with the product usage and distance parameters to determine the contribution of the mobile mode:
Mobile use energy (MJ) = Transport energy per unit mass & distance • Life distance • Mass • Energy equivalence
Mobile use CO2 (kg) = Transport energy per unit mass & distance • Life distance • Mass • CO2 footprint (source)
where
Life distance = Product life (years) • Days per year • Distance per day
The final section of the product definition incorporates two main features. The first is the 'Summary chart' which launches an 'Eco summary' window which displays the life phase chart for the product. This chart updates dynamically as the product definition changes and new products are added for comparison (using the 'Compare with...' feature).
The second feature is the capability to add an image and notes to the eco audit report. This report is compiled by clicking on the 'Detailed Report' button. This is divided into three sections:
Summary page – provides an overview of the eco audit, with headline values for each life phase. This enables rapid identification of the dominant life phase
Detailed breakdown of energy usage (accessed via 'Energy Details...' link on summary page) – provides a component-by-component breakdown of each life phase, enabling the main contributors to the dominant phase to be identified
Detailed breakdown of CO2 footprint (accessed via 'CO2 Details...' link on summary page) – similar to above, except for CO2 footprint.
You can print the report, and export it to Excel, Word, and PDF using the Export button on the eco audit report menubar.
For an overview of an eco audit report, see PET drink bottle example report.
Having identified the dominant life phase and component/s that contribute most to a product's environmental impact, the next step is to identify the correct strategy for reducing their impact. As mentioned in the introduction, the appropriate strategies are highly dependent on both the type of product and the dominant life phase. Guidance on what impact reduction strategies, and performance indices, to consider is accessed by clicking on the dominant life phase bars in the Summary chart.
The strategies for reducing the environmental impact of each life phase can be viewed by clicking on the links below: