Create an attribute expression on a chart axis
An attribute expression is a mathematical combination of attributes in the database, representing a performance index or a user-defined attribute (for example, specific strength (yield strength/density)). You can plot an attribute expression on a chart axis to compare two complex requirements on one selection chart.
Create an attribute expression
In the Chart Settings dialog, click . The expression is displayed in the top pane. To add an operator (plus, minus, multiply etc.) to the expression, click the operator buttons below the expression pane. Click to see an example expression in the dialog.Click to see an example expression in the dialog.
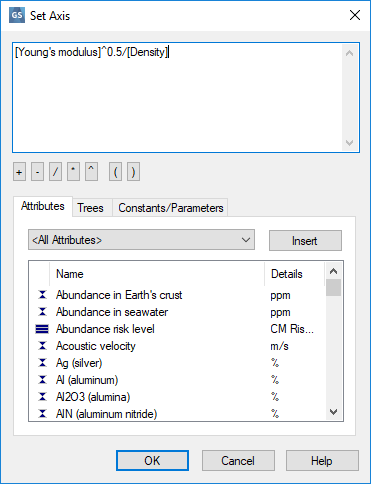
Only numerical attributes, constants, and parameters can be combined in an expression.
Add a logarithm to the expression
- For a logarithm with base 10, type log() into the top pane, and insert the attribute inside the parentheses e.g. log([Density])
- For a logarithm with base e, type ln() into the top pane, and insert the attribute inside the parentheses e.g. ln([Density])
Add an attribute to the expression
- Click the Attributes tab.
- Select an attribute category from the list, if desired.
- Select one or more attributes and click .
The attribute will appear in the top pane at. For example: [Young's modulus]
Add a constant or a parameter to the expression
- Click the Constants/Parameters tab.
- Select Constants or Parameters from the list.
- Select an item and click .
The constant or parameter will appear in the top pane. For example: [Constant:Rest Mass of Electron]
Add record branches to the expression
- Click the Trees tab.
- Select the tree to be plotted from the list.
- Locate and select the branch of interest and click .
The branch will appear in the top pane. For example: [MaterialUniverse:\Metals and alloys\Precious metal alloys]
See also