View and edit stage settings
You can view and edit a number of settings for a selection stage from the Stage Settings dialog.
Open the Stage Settings dialog
Open the Stage Settings dialog to view and edit the stage settings. Do any of the following:
- In a Chart Stage window, click
 Chart settings in the toolbar.
 - In a Limit or Tree stage window, click Settings.
- Right-click on the stage in the Selection Stages list and then select Edit Stage from the shortcut menu.
- Select the stage in the Selection Stages list and then, on the Select menu, click Stage Settings.
Stage title and stage notes
The stage title is displayed at the top of the Stage window, and the stage notes can be viewed by hovering the mouse over the Notes ![]() icon in the stage heading.
icon in the stage heading.
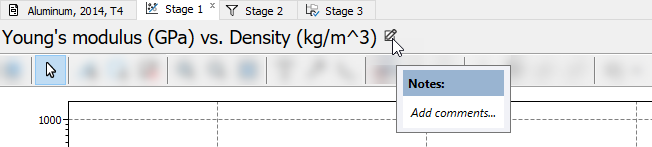
You can edit the stage title and notes in the Stage Settings dialog by clicking on the Notes ![]() icon.
icon.
If you do not specify a stage title, the x- and y-axis titles are used for chart stages, and the applied constraints are used for limit and tree stages.
Pass criteria for the stage (Pass when)
You can specify that, for a record to pass the stage, the range of values for an attribute must lie wholly within the range of the selection criteria, or part of the range may lie outside the selection criteria.
- In the Stage Settings dialog for the stage, in the Pass when list, select Pass when any part of record within selection or Pass when whole record within selection from the drop down list
- Click .

In the above figure, when 'Pass when any part of record is within selection' is set (the default), both records 'pass' the selection. When 'Pass when whole record within selection' is set, only record 1 passes.
Display (Chart stages only)
For chart stages, you can set the following additional chart display properties:
- Show results from all enabled stages – When selected, the records that fail any of the selection stages are shown in gray. The only records that are shown in color are the records that have passed all of the current selection stages.
- Hide failed records – When selected, all records that have failed the current stage are hidden. When used in conjunction with Show results from all enabled stages, the only records that are visible on the chart are the records that have passed all of the selection stages so far. Note that both these tools only affect the chart display, they do not change any of the selection settings.
- Show family envelopes – When selected, an envelope is displayed on the chart around materials in the same family (on bubble charts only) .
X-Axis, Y-Axis (Chart stages only)
The X-Axis and Y-Axis tabs for chart stages specify the settings for the chart axes.
Axis settings
| Axis Title | By default, this will be the name of the selected attribute. You can edit this, if required. |
| Absolute values \ Relative values | If a reference record has been set, you can select Absolute values to display values on the chart as absolute numerical values, or select Relative values to display values relative to the reference record, so that the chart is plotted with the reference record at (1,1). Click to see an exampleClick to see an example
|
| Axis scale |
If the attribute to be plotted is numeric, you can set the axis scale type and range:
|

Parameters
If the attribute to be plotted is dependent on parameters (because it is a functional data attribute or an expression), the values for all the parameters upon which the attribute value depends must fixed in order to make a selection.
To set parameters for functional attributes:
- Select Project Defaults to use project default or individual stage parameter values.
- Click to set the parameter values.
See also