Highlight synthesized records on a chart
In the Chart Stage window, synthesized
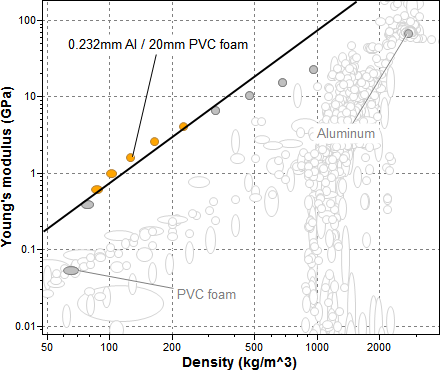
records are plotted in orange by default. To make these records more prominent
on a chart:
- Click Highlight Synthesized Records
 on
the Chart Stage toolbar to highlight
synthesized records on the chart.
on
the Chart Stage toolbar to highlight
synthesized records on the chart.
- If you have not made a selection:
- all synthesized records and source records will stay colored
- all other records will be plotted in white
- If you have made a selection:
- synthesized records that pass will stay colored
- synthesized records and source records that fail will be
plotted in gray
- all other records will be plotted in white
- To stop highlighting synthesized records, click Highlight
Synthesized Records again.