Deciding between plotting an index line or a combined property
The most appropriate technique for charting a performance index will depend on what you want to illustrate on a chart, or the material properties you are interested in.
The main difference is that an index line provides more information on how the material properties influence the index value. If you consider a light, stiff beam in bending (performance index = E1/2/ρ), both aluminum and PS foam have a similar index value, as shown on the bar chart below. However, the index line plot shows that the index value is achieved in different ways for these two materials. The performance of the PS foam is dictated by its low density, while the aluminum is dictated by its high stiffness.
The final choice of material would therefore depend on the load applied when the design is used. Aluminum can sustain high loads, and would be suitable as a wing spar for a commercial airliner; whereas PS foam would be more suitable for a model airplane. (In practice, in the example of the commercial airliner, the PS foam would be filtered out by other design requirements, such as minimum strength.)

Performance index for light, stiff beam loaded in bending – created using a combined property

Performance index for light, stiff beam loaded in bending – created using an index line
Index lines are most informative in cases where you are only considering one performance index, or to illustrate how material candidates change with the applied loading. Combined properties are most suited to instances where you are comparing trade-offs between conflicting objectives, or considering multiple constraints. In these cases, different performance indices need to be plotted on each chart axis, as shown below. This cannot be achieved with an index line.
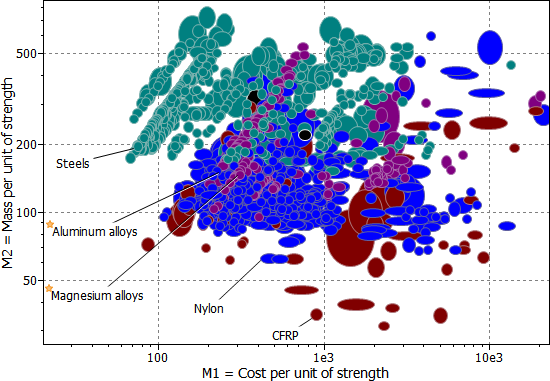
Trade-off with multiple objectives – mass vs. cost trade-off for strength-limited panel loaded in bending
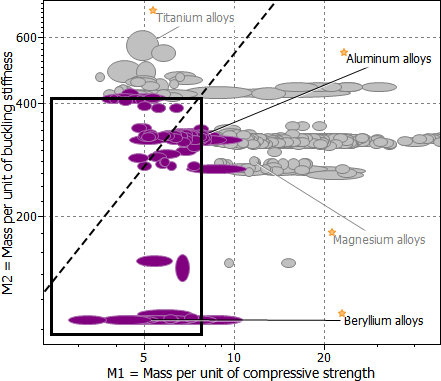
Design with multiple constraints – column loaded in compression with failure occurring by either buckling or compression
See also
- About index lines and performance indices
- Plot a performance index using an index line
- Plot a performance index as a combined property
- How to use the Performance Index Finder
- Build an attribute expression for a combined property
- List of performance indices for materials
- Calculate a performance index from first principles
- 'Materials Selection in Mechanical Design’ by Michael Ashby, Butterworth-Heinemann, for in depth information on systematic selection methodology, derivation of performance indices, and how to use trade-off plots.