About selection charts
You can use selection charts to:
- Visualize materials in property space.
- Explore candidate materials, for example, using family envelopes to look at how data for a given family of materials cluster together.
- Rank materials using index lines and selection boxes.
Any combination of numerical, discrete, logical, and link attributes can be plotted on selection charts. This leads to three different types of charts, according to the combination of attributes used for the chart axes:
-
Bubble Charts: are charts with two 'Numerical' axes. They are called 'bubble charts' because the range of attribute values for each record is represented by a bubble (an ellipse).

-
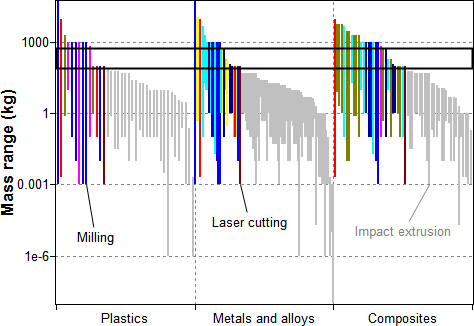
Bar Charts: are created by plotting one 'Numerical' against one 'Discrete/Logical/Link' attribute, or one 'Numerical' axis on its own.

- Count Charts (or tables): are charts with two 'Discrete/Logical/Link' axes or one 'Discrete/Logical/Link' axis on its own. Each record fits into one or more cells of the chart.

Charts can be created with records grouped on the chart axes. Records can be grouped based on links to another data table, or grouped based on the folders in the current browse tree. For example, the chart below has records from ProcessUniverse grouped based on links to material records in MaterialUniverse.
On all selection charts, you can select records using a selection box to define the selection area. On bubble charts, you can also use an index line to select records, with all records on one side of the line passing the selection.